ToffeeWeb Viewpoint
The Law of Moving Averages
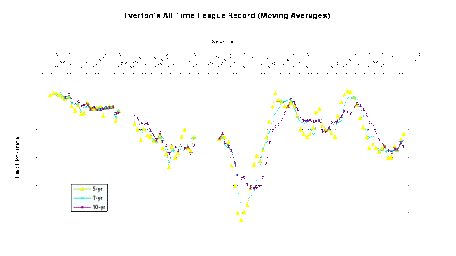
Current perceptions suggest that we are witnessing the worst ever from Everton (today's excellent result at Sunderland aside). Yet, if you know your history, you might recall that Everton in the post-war years (1945-1960) were dire. What followed was the takeover of control by millionaire football fanatic Sir John Moores (1960), the appointment of Harry Catterick (1961) as manager, and one of the most successful eras for Everton, stretching into the 1980s (with a bit of a dip in the dreaded 1970s) before the recent (1990s) fall from grace that sees us plunging into mid-table mediocrity. The cycles of Everton's outrageous fortunes are neatly illustrated in the chart below, which plots Everton's final League position each season as a moving average. Moving averages calculated on 5-, 7- and 10-year windows are shown (click on the chart image for a full-size version): It's interesting to compare the depth of our recent plunge with the catastrophic years after World War II. And the fact that all indicators tentatively suggest we have "bottomed out" at around 14th. If you look closely, you can even see feint signs of an impending recovery.... And the turnaround is occurring under the faltering leadership of David Moyes.
Michael Kenrick
|


